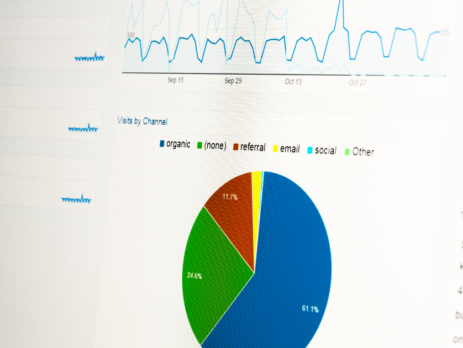
By regularly analyzing Facebook Insights, Google Business Profile Performance, and Google Analytics metrics, you can gain a comprehensive understanding of how users interact with your business across platforms. Use these insights to refine your marketing strategies and drive growth.
You can start by setting a recurring date each month to collect and compare your analytics, and let data guide your business decisions! Here’s a step-by-step guide to accessing and analyzing these insights.
Facebook Analytics
Facebook offers detailed performance data through Meta Business Suite. If your Instagram account is linked (we highly recommend this!), your Instagram analytics will be here in the exact same fashion. Here’s how to find and analyze your monthly analytics:
1. Log Into Meta Business Suite
- Go to Meta Business Suite.
- Log in using the account associated with your business page.
2. Navigate to Insights
- On the left-hand menu, select Insights.
- If you’re managing multiple pages, ensure the correct page is selected from the dropdown at the top.
3. Set the Date Range
- In the Insights Overview, click on the date range filter at the top.
- Select the range for the previous month (e.g., November 1 to November 30).
4. Review Key Metrics
- Reach: Number of unique users who saw your content.
- Engagement: Total likes, comments, shares, and clicks on your posts.
- Page Likes/Followers: Changes in your audience size.
- Top Posts: Identify posts with the most engagement to replicate their success.
Google Business Analytics
Google provides insights into how customers interact with your business listing via Google Business Profile Manager. Here’s how to access these metrics:
1. Log Into Google Business Profile
- Go to Google Business Profile.
- Log in using the account associated with your business.
2. Access Performance Insights
- Click on your business listing.
- In the left menu, select Performance.
3. Set the Date Range
- At the top of the Performance page, choose which month you’d like to view analytics for. (Google Business only keeps the most recent six months of data accessible).
4. Review Key Metrics
- Search Queries: See the top keywords customers used to find your business.
- Customer Actions:
- Calls: Number of calls initiated from your listing.
- Directions: How often users requested directions.
- Website Clicks: Number of clicks to your website.
- Views: Number of times your listing appeared in search and maps.
- Photo Views: How often your photos were viewed compared to competitors.
Google Analytics Website Metrics
1. Log Into Google Analytics
- Go to Google Analytics.
- Sign in with the account associated with your website.
2. Choose the Right Property
- From the Account list, select the account and property for your website.
3. Set the Date Range
- At the top-right corner of the dashboard, click the date picker.
- Choose the range for the previous month (e.g., November 1 to November 30).
- Click Apply to update the data displayed.
4. Review Key Metrics in the Dashboard
Google Analytics provides various insights to help you understand your website’s performance. Focus on the following:
Overview
- Navigate to Reports > Acquisition > Overview to get a summary of traffic sources.
- Key metrics to note:
- Sessions: The total number of visits to your site.
- Users: Number of unique visitors.
- Pageviews: Total number of pages viewed.
- Bounce Rate: Percentage of visitors who left without interacting.
Traffic Sources
- Go to Reports > Acquisition > Traffic Acquisition to see where your traffic is coming from:
- Organic Search
- Paid Search
- Direct Traffic
- Social Media
- Referral Links
Engagement
- Visit Reports > Engagement > Pages and Screens to find:
- Top Pages: Pages with the most views.
- Average Engagement Time: How long visitors stayed on each page.
- Conversions: Actions like form submissions or product purchases (if set up).
Audience Demographics
- Under Reports > Demographics > Overview, check user demographics such as:
- Age
- Gender
- Location
- Device usage (desktop, mobile, tablet)


